The Bill
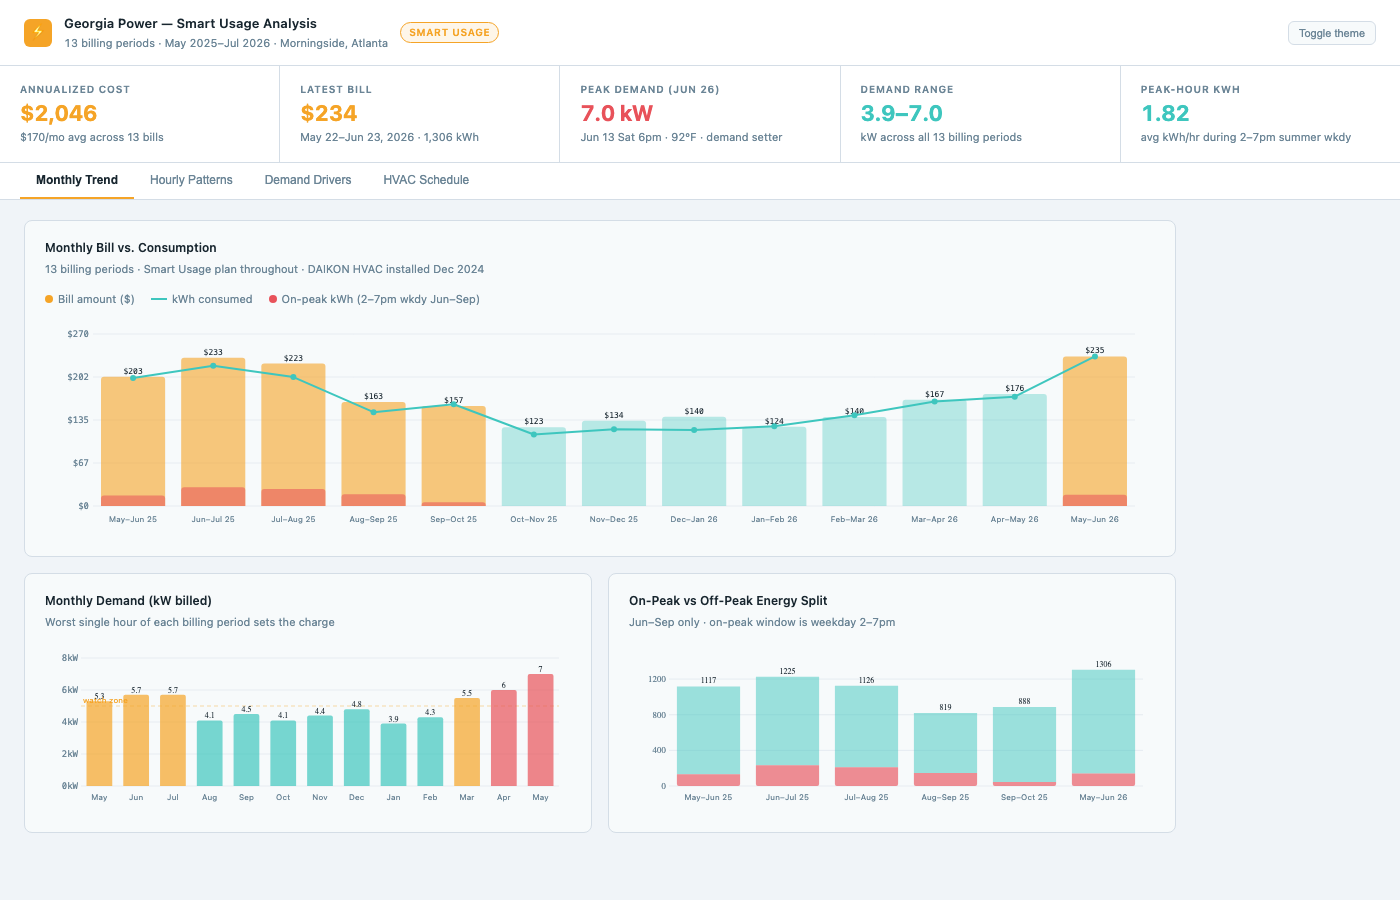
The trigger was a $252 bill — against winter bills around $63 — right after we installed a new HVAC system. My first assumption was the obvious one: air conditioning during the 2–7pm summer peak window, the thing the Smart Usage rate plan trains everyone to optimize.
That assumption was wrong.
It Was Just One Hour
Smart Usage has a second component most people ignore: a demand charge, set by the single worst one-hour draw of the month — any hour, any day, not just the 2–7pm window. A single high hour can outweigh careful behavior during the rest of the month. Pre-cooling before 2pm saves on-peak energy costs but does nothing for demand if the worst load lands on a Saturday evening.
And it does. Our expensive hours were mostly weekends, when the HVAC compressor, meal prep, the dryer, and sometimes car charging all overlapped. The June 2026 demand charge was set on a Saturday at 6pm at 92°F.
The question that mattered after the first spike: is this a fluke, or is this a common occurrence? So I pulled 13 months of bills and 10,487 hourly readings to find out.
What the Data Showed
- 19 of the top 20 highest single-hour reads were off-peak, mostly evenings and weekends
- Over 13 billing periods, 90 hours exceeded 4 kW — 92% of them off-peak, and 59% on weekends
- The culprit is almost always the same combination: the HVAC compressor and the dryer running in the same hour on a hot day
The Real Question
The point was never the chart — it was household behavior. It’s hard to tell Jeannie “use less” if I can’t say which behavior actually matters. The data gave a specific answer: avoiding the dryer-plus-HVAC overlap on hot days matters more than any generic conservation advice.
What Changed
The analysis produced a concrete Skyport schedule for our Daikin system: pre-cool to 70°F before the 2pm on-peak window, set back to 77°F during it, and let thermal mass carry the house. Weekends get pre-cooling too on any day forecast above 85°F. And the one rule that matters most costs nothing: never run the dryer while the HVAC is actively cooling.
Unmeasured: the household behavior change is still being negotiated, not fully implemented.
What’s Modeled vs. Measured
The savings scenarios — roughly $46, $77, and $120 per year depending on how much behavior changes — are modeled from the rate structure, not measured from later bills. Still unfinished:
- Validating the model against bills that arrive after the schedule change
- A flat-rate plan comparison to sanity-check whether Smart Usage is even the right plan
- An unexplained overnight base load (the 2–4am floor is higher than this house should draw) that deserves its own investigation
The Dashboard
The full interactive dashboard — monthly trends, hourly patterns, demand drivers, and the HVAC schedule — is live at dimadimadima.com/power.